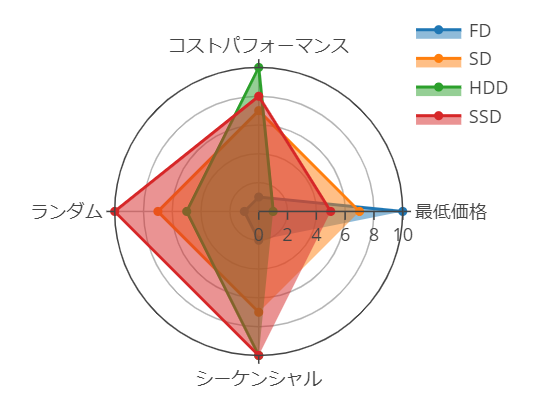
Plotly.jsでレーダーチャートを表示するためには、用意するデータにてtypeプロパティを’scatterpolar’に指定します。また、thetaプロパティにラベル名、rプロパティに値を指定します。
また、layoutの設定でレンジ幅の指定や、回転の設定が必要になるかもしれません。
サンプル:フロッピーやハードディスクの比較

let graph = "myDiv";
let data = [];
let layout = {};
let config = {};

let theta = [
    '最低価格',
    'コストパフォーマンス',
    'ランダム',
    'シーケンシャル'
];
data = [
    {
        type: 'scatterpolar',
        name: 'FD',
        r: [10, 1, 1, 2],
        theta: theta,
        fill: 'toself'
    },
    {
        type: 'scatterpolar',
        name: 'SD',
        r: [7, 7, 7, 7],
        theta: theta,
        fill: 'toself'
    },
    {
        type: 'scatterpolar',
        name: 'HDD',
        r: [1, 10, 5, 10],
        theta: theta,
        fill: 'toself'
    },
    {
        type: 'scatterpolar',
        name: 'SSD',
        r: [5, 8, 10, 10],
        theta: theta,
        fill: 'toself'
    },

]

layout = {
    polar: {
        radialaxis: {
            visible: true,
            range: [0, 10],
//                        angle: 90,
//                        tickangle:0
        },
        angularaxis: {
//                        rotation:90
        }
    },
    showlegend: true
}

Plotly.newPlot("myDiv", data, layout);
